How EDI works
For the measurement of Doppler wavelength shifts


Conventional method requires high resolution
The conventional method of measuring Doppler wavelength shifts of starlight requires a very high resolution spectrograph, because the individual spectral features need to be resolved. Unfortunately, for large telescopes these spectrographs are very large (kitchen sized) and expensive (millions of dollars). This is because the spectrograph size is proportional to both the telescope aperture size and the desired spectral resolution.

The animation on the left depicts a few hypothetical absorption lines in the stellar spectrum moving back in forth in wavelength. The goal is to measure their wavelength shift relative to the lines of another spectrum, a reference source (not shown) which is often the iodine or ThAr lamp spectrum. The actually shift to be measured (over days, months, years) is much smaller than the width of a absorption line itself by a factor of 100 or more... so the measurement is a very difficult one to do accurately, and requires the instrument response to be extremely stable over a long time. This is hard to achieve.

For many observatories which cannot afford the cost or space of a high resolution spectrograph, they would only be able to measure the low resolution spectrum depicted in the right panel. The low resolution seriously degrades the strength of the Doppler signal, both because it reduces the measured depth of the absorption line, but also because it increases its width which decreases the slope of the spectrum on the side of the line, which is where the Doppler signal is strongest. The result is that the Doppler signal decreases very strongly with decreasing spectral resolution (R), as R to the 3/2 power.

Conventional Doppler Measurement

High Resolution
(Requires $$)

Low Resolution
(Poor signal)

EDI Doppler Measurement

High Resolution

Low Resolution
Moire motion can easily be seen at low res

EDI Method tolerates low resolution
In the externally dispersed interferometry method an interferometer is inserted into the beam near the spectrograph slit. This fixed delay interferometer has a sinusoidal transmission "comb" that varies periodically with very small changes in wavelength-- it is very sensitive and mathematically very regular. This interaction creates moire patterns in the spectrum which change in phase under very small Doppler shifts (see animation above). The moire patterns are high spatial frequency details in the stellar spectrum heterodyned to low spatial frequencies (broad patterns) where they more easily survive spectrograph blurring and distortions. (Heterodyning is described further below.)

Doppler shift from Moire phase change
By making the interferometer delay slope a very small amount vertically along the slit, the interferometer transmission comb is tilted so that small Doppler phase changes in the moire pattern creates large perceived transverse motions. Note how easily the vertical motion of the moire pattern can be seen in the animation (from across the room, even), responding to very small horizontal motion of the input spectrum. Under spectrograph blurring it is much easier to see the moire pattern change than the motion of the blurred stellar lines themselves.

The phase shifts of the iodine (reference) and stellar moire patterns are subtracted from each other to eliminate instrumental effects. This relative phase shift is independent of the detailed value of the interferometer delay. Multiplication by 15,000 m/s per fringe then yields the Doppler velocity.

Section of a solar fringing spectrum at low resolution, showing that the moire fringes persist even though the underlying absorption lines cannot be resolved, nor can the interferometer comb be resolved.

At high Res the EDI signal adds to the conventional
For high resolution spectrographs, the EDI is also useful because it is a statistically independent Doppler signal that can be added to the conventional signal. (The EDI moire patterns and the conventional stellar lines occupy different spatial frequencies on the spectrograph CCD, so they respond to noise in an independent fashion.) The combination of conventional + EDI Doppler signals will always be greater than the conventional used alone.
Moire patterns persist at low Res

These moire patterns persist in spite of the blurring present in compact and inexpensive low resolution spectrographs. This is

because the multiplicative interaction between the interferometer transmission function and the stellar spectrum can be thought of as occuring prior to, or independent of, the blurring. It can be shown that the EDI Doppler signal strength varies more slowly versus R (for a fixed bandwidth) as the conventional, as R to the 1/2 power for low R instead of R to the 3/2 power. Hence for low R, the EDI has a dramatic advantage.


Numerical simulation of a moire fringe created by a single Gaussian absorption line of full depth, versus various amounts of spectrograph blurring. This demonstrates that the moire pattern persists under blurring. (Wavenumber is 1/wavelength and is a more mathematically convenient unit for interferometry.)


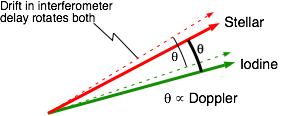
Moire phases for starlight and a spectral reference (iodine) can be represented by two vectors (red & green ink). Minor drift in interferometer delay with temperature, between solid and dashed, does not affect measured Doppler velocity, because it affects both the stellar and reference spectrum (iodine) fringes by the same amount. Therefore it sufficient to stabilize interferometer only to ~λ/4, which is easy. Drifts of larger than λ/4 during a time exposure only affect the measurement through a decrease in the average fringe visibility.

The EDI is a differential technique robust to apparatus distortions
The EDI is robust to apparatus wavelength distortions that threaten the Doppler velocity stability of conventional spectrographs. This is because the interferometer comb is embedded with the stellar spectrum, so they are shifted together the same amount by aberrations in spectrograph optics, thermomechanical drifts in the CCD, air convection etc. The interferometer comb can be thought of as a grid of evenly spaced wavelength fiducials that fills the entire bandwidth.

Secondly, the
phase stepping used with EDI eliminates fixed pattern errors, such as irregular gain of CCD pixels, by using only the component of the spectrum that varies synchronously with phase stepping applied to the interferometer through the PZT mirror. Conventional spectroscopy has difficulty removing these types of errors to the precision needed for Doppler velocimetry, because they are done in separate "flatfield" exposures a long time before or after the data exposures, not in real-time using the Doppler data itself.

The 2nd interferometer arm is used too
The interferometer has two outputs that are out of phase by 180 degrees, so that the sum of the outputs equals the input, and whenever there is a dark fringe in one output there is a bright fringe in the other. Our protype EDI's have ignored the 2nd output for expediency. However, our future designs for mature EDI instruments use both outputs [
example] so that none of the photons are wasted (except for ordinary losses on mirror coatings and lens glass/air interfaces, which is minor). The second interferometer output would be directed to a different spot on the same CCD.

Elegant vector math simplifies analysis
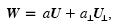
We have developed elegant vector mathematics for easily determining the phase of the stellar moire pattern from the phase of the iodine reference pattern, even though they are embedded in the same signal. This is a quick and direct calculation using dot products, and is rapid even on laptop computers.

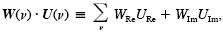
The moire pattern is represented as a vector spectrum. That is, each wavelength channel is a vector and the vector's magnitude and angle represents the fringe visibility and phase. This vector spectrum is conveniently represented by a complex wave. The beauty of this is that all popular math software packages have standard mathematical functions written for complex quantities, such as addition, subtraction, multiplication, and Fourier transforms.


The great advantage of phase stepping during data taking is that it eliminates a whole class of significant instrumental errors called fixed-pattern-errors, which can cause large velocity offset errors. The measured moire pattern (represented by a vector) is a sum of an unknown fixed pattern error plus the "good" signal. The "bad" signal is easily obtained by summing the four measured signals, taken with phase steps of 0, 90, 180 and 270 degrees. Conversely, the good signal is easily obtained by summing the four measured signals after first rotating by 0, -90, -180, and -270 degrees. This phase-stepping can be thought of as a kind of "flat-fielding" that is done in real time with the actual data. In contrast in a conventional spectrograph, the flat fielding is done in separate exposures long before or after the Doppler measurement, allowing unknown drifts to creep in.

Easy dot-product calculation
While each individual wavelength channel is a vector, what is new is that we can also treat the entire moire pattern as a vector. We define the dot product between two moire patterns W and U to be the sum of the channel-by-channel dot product over all CCD channels.
where "Re" and "Im" represent the real and imaginary parts of two moire patterns, and the Greek symbol nu represents the CCD dispersion channel. Suppose U is the "template" version of the moire pattern, which is the ideal version measured at zero velocity. Then the rotation of the measured moire can be found by representing the measured moire W by a sum of the template and the template rotated by 90 degrees (indicated by the perpendicular sign). Then the moire pattern phase is
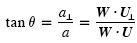
found from the dot product .

That is the simple result. A more sophisticated result that takes account of the presence of the iodine and stellar components together is to use four terms:
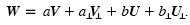
, with U and V being the stellar and iodine moire patterns. Then the dot product analysis becomes a set of four linear algebra equations, which have a direct answer. The analysis is described in
Ref. 4.

How it works (Res Boosting)

www.SpectralFringe.org site maintained by
David Erskine
erskine1@llnl.gov

Back to EDI home