Project "TEDI" |
||||
Updated August 2011 |
||||
|
||
In the TEDI project, an EDI interferometer was built to fit inside the Cassegrain output hole of the Mt. Palomar 200 inch telescope to demonstrate a novel technique for a Doppler planet search in the near infrared (0.9-2.5 micron), for planets around cool stars, which are the majority star type. Instead of measuring Doppler wavelength shifts with a spectrograph alone, which requires a very high resolution spectrograph, the shifts are observed in fringes in a small interferometer. The interferometer is used in series with a spectrograph, but this spectrograph is just a "helper" device that separates the many wavlength channels so that their fringes don't overlap-- it doesn't make the fundamental measurement. Thus the EDI technique enables the spectrograph to be of lower resolution and thus smaller size. Since the spectrograph is usually the largest and most expensive component of the system, this allows the whole instrument to be 10x or more compact. |
||
 |
||
|
||

 |
||||||||||||
 |
||||||||||||
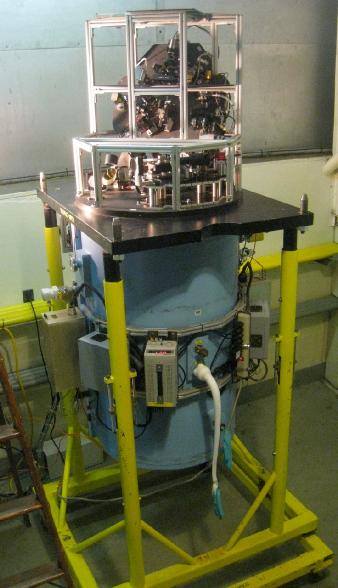
The EDI technique allows use of a much smaller lower resolution spectrograph, because the fine measurement of the Doppler wavelength change is done by the interferometer not the spectrograph. The spectrograph TEDI uses is in blue, being attached to the Cassegrain output hole in the 200 inch mirror. In the photo to the right it's in the cage area at the bottom of the mirror. |
||||||||||||
 |
||||||||||||
 |
||||||||||||
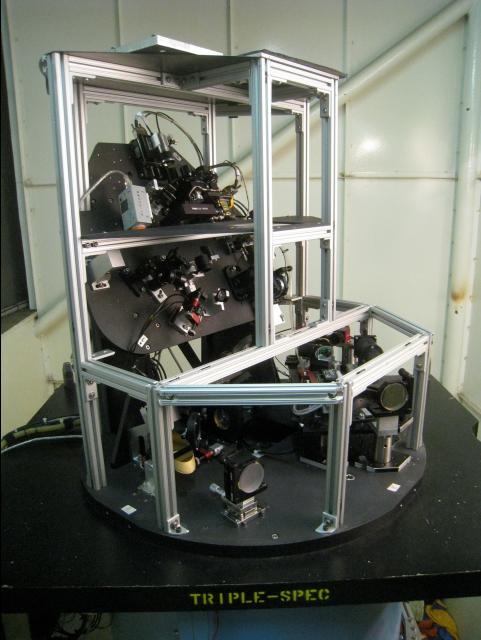
The TEDI interferometer sits on top of the blue cylinder and appears black and silver in these photos. It is constrained to intercept the starlight beam, process it, and then return it to its original path and cone angle so that it enters the spectrograph as if nothing had happened. This explains why there are so many mirrors. The interferometer portion is in the top angled plate. It creates a path length difference (delay) selected from 8 choices in a "filter wheel", of up to 4.5 cm, |
||||||||||||
 |
||
Example reconstructed spectrum of starlight (kappa CrB) to a resolution 10x higher than the Triplespec spectrograph used without the EDI. The green dashed curve is the Triplespec spectrum without benefit of the interferometer, at a resolution of 2700. It cannot resolve many of the narrow features caused by atmospheric absorption (telluric lines). The red curve is the spectrum reconstructed by combining 7 delays worth of fringing data and special Fourier processing, in a technique called ISR (interferometric spectral reconstruction) or resolution boosting. It has an effective resolution of 27,000 and agrees well with a model of telluric features calculated by Henry Roe and artificially blurred by us to that resolution. A ThAr spectral lamp provides calibration emission lines. This graph shows only a small (110 cm-1) section of the reconstructed bandwidth which extends 6000 cm-1 from 4000 cm-1 to 10000 cm-1. The ISR technique is described in these 3 papers: link2, Scot16Bppr2.pdf, BoostApJ1693b.pdf. |
||
TEDI measurement of the velocity of star GJ 699 over 3 months shows the velocity measuring capability, since this star is known not to have exoplanets and thus can be used as a velocity reference. Several velocity components can be seen in the data (left). The 3 month downward trend is due to the motion of Earth around the sun. The daily cycle is due to Earth's rotation (inset). After subtracting these known components the residual is obtain (bottom graph), which hovers around zero velocity with a scatter that is due to a random component from photon noise, plus a systematic error component of about 15 m/s. |
||||
 |
||||
 |
||||
The amount of systematic noise was determined in the graph to right by combining larger and larger residual datasets together (N Bins plotted on horiz axis) and plotting the net scatter, which should behave in a square root behavior if the scatter was purely random. A model which includes a 15 m/s systematic component (dashed curve) best fits the data. |
||||
Team TEDI page |
||
Site maintained by |
||||
The latest 3 TEDI papers:
Link1. "Precise Stellar Radial Velocities of an M Dwarf with a Michelson Interferometer and a Medium-Resolution Near-Intrared Spectrograph", Muirhead et al, PASP 123: 709-724 (2011).
Link2. "Ten-fold Spectral Resolution Boosting using TEDI at the Mt. Palomar NIR Triplespec Spectrograph", Erskine et al, SPIE 8146, paper #22, 2011.
Link3. "Near Infrared Interferometric Spectroscopy with TEDI", Edelstein et al., SPIE 8151, paper #23 (2011).
Other TEDI papers:
Link4. “Mass Producing an efficient NIR spectrograph", Wilson et al, SPIE 5492, 1295-1305 (2004).
Link5. "Externally Dispersed Interferometry for Planetary Studies", Erskine et al, SPIE 5905, 249-260 (2005).
Link6. "The TEDI Instrument for Near-IR Radial Velocity Surveys", Edelstein et al., SPIE 6269 (2006).
Link7. "Noise Studies of Externally Dispersed Interferometry for Doppler Velocimetry", Erskine et al. SPIE 6269 (2006).
Link8. "TEDI: the TripleSpec Exoplanet Discovery Instrument", Edelstein et al., SPIE 6693 (2007).
Link9. "Dispersed Interferometry for Infrared Exoplanet Velocimetry", Edelstein et al., SPIE 7014 (2008).
Link10. “Infrared Radial Velocimetry with TEDI: Performance Development”, Edelstein et al., SPIE 7735 (2010).
Link11. “Precise Infrared Radial Velocimetry with the Triplespec Exoplanet Discovery Instrument: current performance and results”, Muirhead et al., SPIE 7735 (2010).
What's cool:
1. We can do Doppler radial velocity planet search with an instrument 10x smaller (1000x smaller in mass) than the conventional method, and in the near-infrared, which is the best wavelength range for the majority of stars.
2. We can boost the spectral resolution of any grating spectrograph by 10x or more! reducing the mass of high resolution wide bandwidth spectrographs by 1000x.
What's noteworthy about this EDI:
• Works on an echelle spectrograph instead of a linear spectrograph (echelles have much wider bandwidth)
• Phase is uniform across whole beam, not splayed spatially across a slit (allows small focal spots such as on echelle spectrographs, potentially imaging spectroscopy).
• Each detector pixel is used throughout phase stepping, eliminating fixed-pattern detector irregularity (essentially automatically flat-fields itself)
• HgCdTe detector works in near-infrared where the bulk of star's flux lies
• Robust to a changing gravity vector (since mounted to telescope which swings)
• Works successfully in a remote location (Cassegrain cavity is inaccessible while telescope is in observing mode)
• Use of ThAr emission lamp enables wide bandwidth operation at high photon S/N
Motivation:
The figures below show how with the conventional technique a very large spectrograph would be needed-- too large and costly to be built.