Jun 2026 |
||||
|
||||
Externally Dispersed Interferometry |
||
EDI is a novel technique for the Doppler planet search |
|
A method for boosting the Doppler sensitivity, spectral resolution, and wavelength stability of dispersive spectrographs, by adding a small interferometer into the beam and analyzing the fringe patterns |
|
With the EDI, your inexpensive & compact spectrograph can now perform: |
||
 |
||||||||
The EDI Method • The interferometer causes a periodic fringe vs wavelength • The fringe pattern beats with the spectrum • Heterodyning creates a moire pattern • High-resolution features are measurable through the moire • Nyquist limit and slit blurring are defeated • The fringe fiducial allows error removal • Phase stepping nulls instrumental errors |
||||||||
|
||||||||
Doppler wavelength shifts are measured through phase shifts of "fringes" which form moire patterns seen in the spectrum. (The interferometer can't be used effectively alone because otherwise the fringes of many different wavelengths having many different phases would fall on the same detector pixels and wash itself out.) The grating spectrograph separates the fringes so that the fringe visibility can be high. But otherwise the key role of measuring a Doppler shift is with the interferometer. |
||||||||
How EDI measures Doppler shifts The interferometer is the "vernier", the grating the "coarse" readout |
||
More explanation on how EDI works for Doppler velocimetry is at this page. |
||
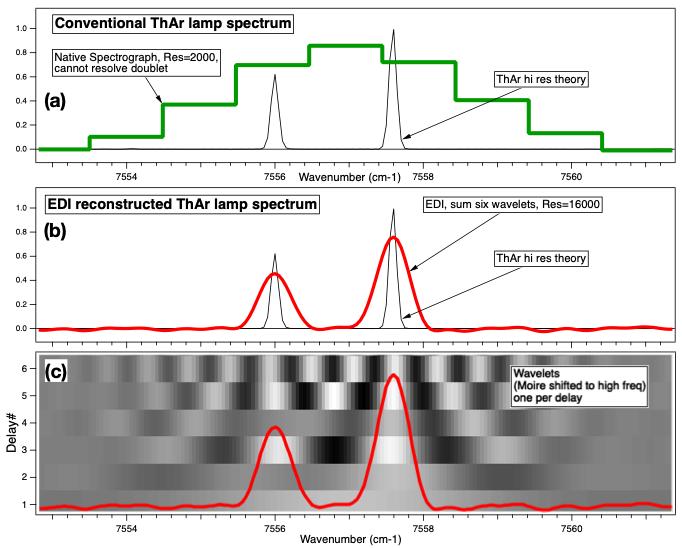
How EDI measures High Resolution Spectra-- beyond disperser capability Each measured moire pattern is mathematically processed to reverse the heterodyning effect, creating a wavelet. |
||
More explanation on how EDI boosts spectral resolution is at this page. |
||
Site maintained by |
||
10x resolution boost demo'd on starlight at Mt. Palomar 200 inch Hale telescope
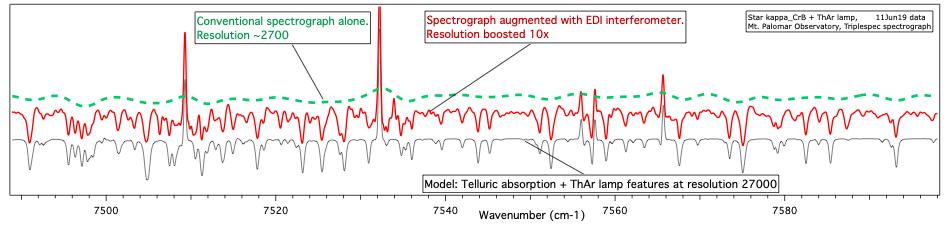
Demonstration of a 10-fold resolution boost observing telluric features mixed into spectrum of star κ CrB along with ThAr calibration lamp emission lines. The green dashed (top) curve is the “ordinary” spectrum measured without the interference, having native resolution 2700. It cannot resolve any of the telluric features. The red (middle) curve is the EDI (TEDI) reconstructed spectrum measured with seven contiguous delays, up to 3 cm, and equalized to a Gaussian resolution of 27,000. The gray (bottom) curve is a model of telluric and ThAr features blurred to resolution of 27,000, showing excellent agreement with EDI reconstructed data. Resolution boosting occurs simultaneously across the full bandwidth (0.9 to 2.45 μm) of the native spectrograph (final resolution varies linearly with wavenumber times largest delay). Y-axis is intensity, vertically offset for clarity. Data from June 19, 2011. See Ref. 26.
Website host
David J. Erskine
derskine@spectralfringe.org