Single-delay EDI on Solar Spectrum: 2.5x Resolution Boost |
||
 |
||
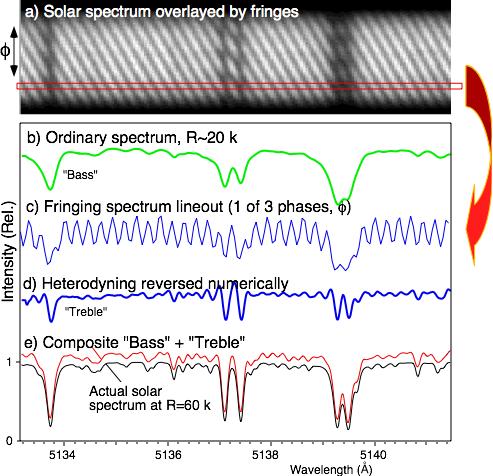
The EDI resolution boosting effect was demonstrated in 2001, where the R~20,000 resolution of a linear grating spectrograph was effectively boosted to R~50,000 observing the solar spectrum. The data used was recorded on June 16, 1998 using the first EDI apparatus. Note that data can be taken by the same apparatus, and processed with different algorithms to obtain either Doppler velocity or high resolution spectra. This page is a demonstration of the latter. The "bass" green curve (b) essentially shows the spectrum measured in the conventional fashion without the fringes, simply by averaging the data in (a) along the Y-axis. Many details in the absorption lines are not resolved and the resolution is R~20,000. The blue curve (c) shows a lineout along the X-direction of raw data (a). Three such lineouts are needed, taken at different phases (Y-position) 120 degrees apart. This provides all the needed information to reconstruct both the real and imaginary parts of the signal. The "treble" curve (d) is formed by reversing the heterodyning, by temporarily transforming to Fourier space, translating by a fixed amount given by the interferometer delay, and then inverse transforming. The red composite spectrum (e) is obtained by combining the "treble" and "bass" curves. This has nearly the same resolution as the theoretical solar spectrum artificially blurred to R~60,000 shown as black in (e). For more info see Ref. 7 & 8. To see a demonstration of EDI resolution boosting on starlight using the Lick echelle grating, go here. |
||
Site maintained by |
||||