Early History of Externally Dispersed Interferometry


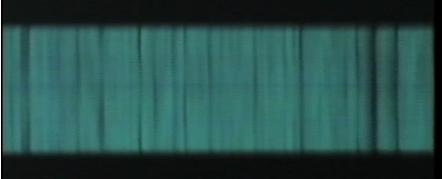
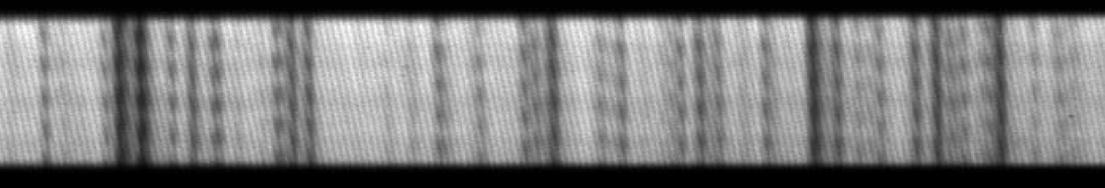
Fig. H0. The earliest fringing spectra of sunlight through an iodine reference cell were recorded by David Erskine at LLNL. Above is a frame from a video made April 8, 1998 looking at the spectrograph output, after sunlight collected from a rooftop fiber sends light through the iodine cell, then the interferometer, and then into the spectrograph. Phase varies transversly, and wavelength varies horizontally.

EDI was invented by Erskine in 1997 as a natural outgrowth of his
white light Doppler interferometry work

Since 1987 David Erskine at Lawrence Livermore Nat Lab has measured Doppler velocities interferometrically on laser-illuminated targets in shock physics experiments. Phase stepped data analysis to achieve high fringe shift precision, as well as the use of wide-angle interferometers, was standard for this technique which had been in use since the 1970s.

White Light Velocity Interferometry
In 1995 he surprised conventional wisdom by inventing a method of substituting ordinary incoherent white light for the monochromatic and coherent laser illumination. It had been dogma that coherent illumination was mandatory to produce fringes. He broke convention by first passing the white light through a preparatory interferometer prior to reaching the target. If the preparatory interferometer has a similar delay as the detecting one, then high visibility fringes result
even though the illumination source is broadbanded and incoherent, i.e. even though the interferometer delays are much longer than the original coherence length. This work was described by a letter in Nature and US patent 5,642,194.

(The practical benefit is that this allows for the first time the use of powerful and inexpensive light sources such as flashlamps, shock-generated incandescent plasmas, and chirped illumination-- where the wavelength of monochromatic light is rapidly changed with time to provide a way of measuring time dependent phenomena using a chromatically dispersed streak recording camera.)


Figure H1. The of use dispersion in combination with interferometers to increase fringe visibility was familiar to Erskine from his 1995 work inventing white light Doppler velocimetry. This application differs from measuring the Doppler velocity of stars in that the target needs to be illuminated. Erskine discovered that by first sending white light through a preparatory interferometer prior to the target then fringes could be obtained in the detecting interferometer in spite of complete lack of coherence of the illumination source. Including a disperser increases the fringe visibility when the delays of the two interferometers are not perfectly matched or the Doppler velocity range is wide. From Fig. 5A of US patent 5,642,194.

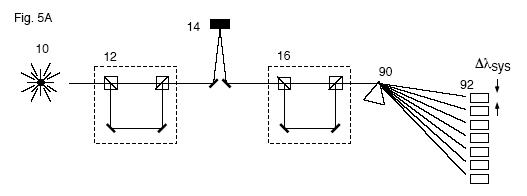
Two interferometers in series with a disperser
From 1995-1997 he explored many variations of this technique, and four additional US patents resulted, including applications to broadband radar and ultrasound. He explored the combination of two interferometers and a dispersive spectrograph in series. The purpose of the dispersion was to increase the fringe visibility when the delays of the two interferometers did not match carefully or when the Doppler velocity changed over a wide range. These interferometers were also designed to be angle independent so that the same delay is imprinted on all the rays of an uncollimated beam. In late 1996 he experimentally demonstrated the measurement of a few meters/sec velocity from a 2-dimensional target in an
imaging white light velocity interferometer.

Modification for measuring starlight or sunlight velocities
Soon after, when he heard the need of astronomers to measure velocities of stars in the Doppler planet search, he thought this would be an ideal application for an interferometer. He knew that dispersion in series with the interferometer would be required to improve the fringe visibility, because the starlight was almost white light. Because the stellar spectrum already has many narrow features, (and because it makes no sense to illuminate a star which already is a source of light), the preparatory interferometer was eliminated. Hence his instrument concept evolved into the series combination of just a single wide-angle interferometer with a disperser. The angle-independent design of the interferometer would allow use with blurry star images, wide diameter optical fibers, and 1-d imaging along the input slit.


Figure H2. Erskine's 1997 proposal to LLNL for an instrument to measure stellar radial velocities was to combine a single angle-independent fixed-delay interferometer in series with a disperser. Doppler shifts would create phase shifts in the fringes. The disperser would greatly increase fringe visibility, and the angle independence of the interferometer design would allow use on wide optical fibers and blurry star images. Phase stepping data collection techniques would be used to increase accuracy of phase measurements. An iodine cell (not shown) or other spectral reference would also be measured so that the absolute value of the interferometer delay would not need to be known precisely and could wander during measurement slightly.

Invention of EDI
Externally dispersed interferometry (EDI) was invented by David Erskine in 1997 at LLNL, and this technology is described in Fig. 28 of 6,115,121 "Single and Double Superimposing Interferometer Systems", and to a greater extent in US patent 6,351,307 "Combined Dispersive/Interference Spectroscopy for Producing a Vector Spectrum". In addition to Doppler velocimetry, this latter patent describes a variety of applications for the instrument including high resolution spectroscopy, the measurement of angles when used with a long baseline interferometer [astrometry], and other metrologies. ("Superimposing" here means wide-angle or angle-independent-- see Terminology.)

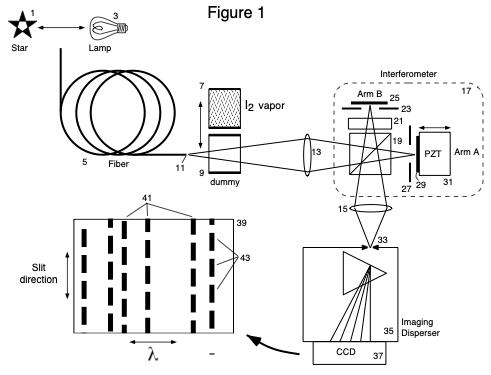
Figure H2b. Schematic of EDI concept in Jan 1997, from Fig. 28 of US patent 6,115,121 "Single and Double Superimposing Interferometer Systems".

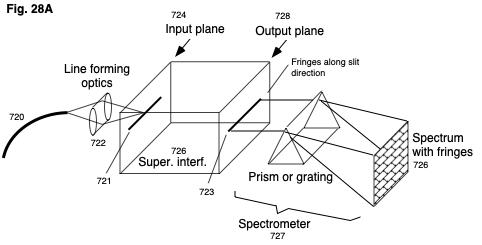
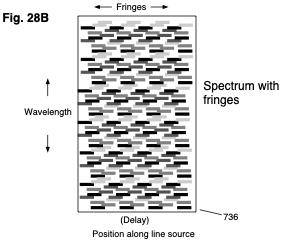
Figure H2c. Schematic of EDI apparatus, from US patent 6,351,307 "Combined Dispersive/Interference Spectroscopy for Producing a Vector Spectrum".

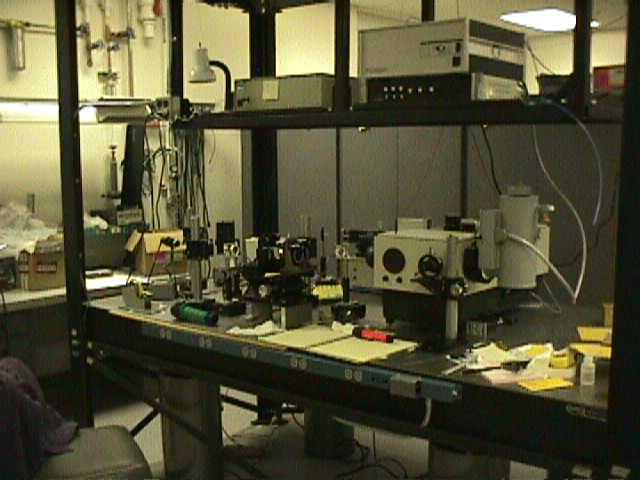
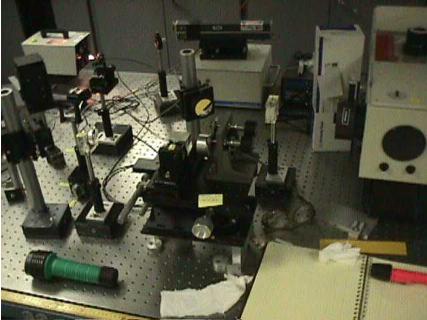
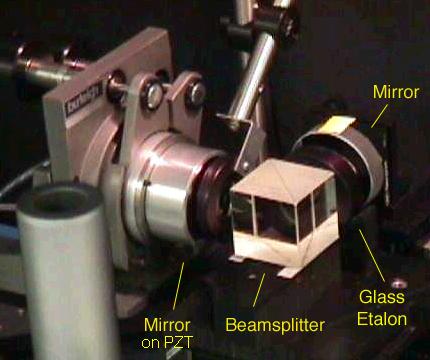
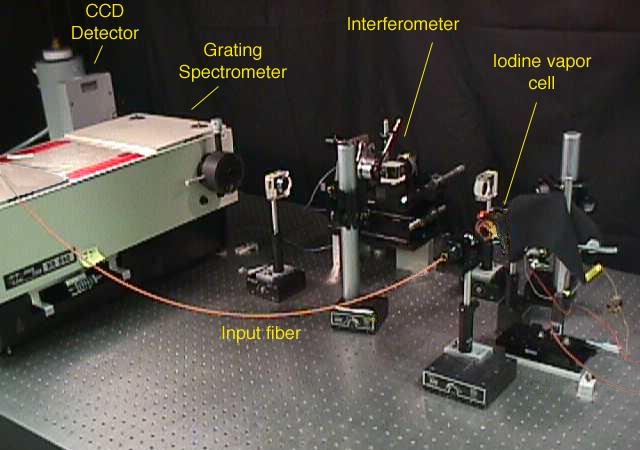
The first EDI built and demonstrated in spring of 1998 on sunlight
Erskine was the principle investigator of the LLNL project
* 1997-2000 to build and demonstrate the EDI planet search instrument on starlight. He built the first EDI apparatus March 1998 while working alone, and tested it in the laboratory on sunlight beginning April 1998. A fiber from a rooftop heliostat (Fig. H5) brought sunlight down to his laboratory where it passed through an iodine cell, the wide angle interferometer, and finally into a ~20,000 resolution Jobin-Yvon spectrograph. A wide-angle interferometer design suitable for ~1 centimeter delay lengths, based on work of Hilliard and Shephard (1966) was used. Figures H3-5 show the apparatus in March 1998,
Figs. H6-7 on June 2, 1998, and Fig. H10 is a schematic. Figure H0b still and H0 movie shows data on April 8, 1998, and Fig. H8 shows a solar fringing spectrum taken May 16, 1998.


Figure H3. EDI lab at LLNL March 23, 1998 showing optical table with first EDI apparatus. Shelf above it holds controllers for PZT, CCD and spectrograph. Light source is sunlight from a fiber leading from rooftop heliostat (Fig. H5).


Fig. H0b. Frame from movie of Fig. H0 at top of page, which is fringing spectra of sunlight through an iodine reference cell recorded by David Erskine at LLNL April 8, 1998. Phase varies transversly, and with time, and wavelength varies horizontally. Measuring fringes at several phases allows fringing and nonfringing components to be separated.


Figure H4. First externally dispersed interferometer, 23 March 1998, is set of optics on black labjack (with yellow postit note), imaged to the Jobin-Yvon spectrograph (right) via a lens and mirror. Other pieces of equipment are useful for alignment or datataking.


Figure H5. Heliostat on roof of building (directly above lab) was a Meade ETX-90 telescope mount with built-in clock drive, with the telescope replaced by a mirror that reflected light into a stationary fiber on polar axis. Aluminum foil reduced temperature. Angle of fiber in 2-axes could be adjusted from the lab via remote control to center the fiber by maximizing flux. March 1998.


Figure H8. Portion of a fringing spectrum of sunlight taken with the first EDI apparatus May 16, 1998. Data taken today by modern EDI's is done in the same manner and has similar appearance. The number of fringe periods across the spectrum height is not critical and is adjusted by an interferometer mirror tilt. Full spectrum was 2500 pixels wide covering ~120 Angstroms in the green, at ~20,000 resolution. The beadlike patterns are the moire fringe, which is an interaction between the narrrow absorption line of the input spectrum and the sinusoidal transmission of the interferometer. The phase of the moire fringe indicates the detailed position of the absorption line to the nearest interferometer transmission fringe, and changes with Doppler shift. Fringing spectra of an iodine absorption cell are also measured. Subtracting the phase change of the sunlight from the iodine yields the Doppler induced effect independent of drifts in the interferometer delay, so the delay does not need to be precisely controlled (a quarter wave stability is sufficient).


Figure H6.
Closeup of interferometer on 6/2/98. One mirror was mounted on PZT translater so that interferometer delay could be adjusted by small amounts, to do phase stepped data taking, and (later) to stabilize the delay to thermal drifts. Glass etalon, in concert with a displacement of the other mirror, creates an angle independent delay between the two interferometer arms of about 11 mm.


Figure H7. Photo of the first EDI apparatus taken June 2, 1998 in preparation for presenting the project's results to the LLNL funding committee. Sunlight from roofmounted heliostat comes from fiber and passes through an iodine cell, then the wide angle interferometer, and finally into the Jobin-Yvon spectrograph having ~20,000 resolution.

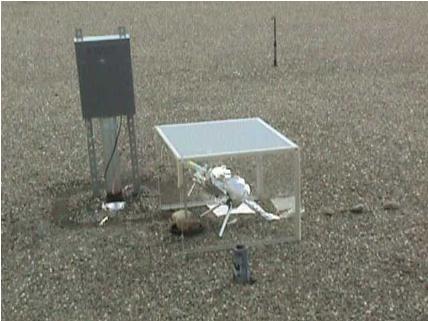
Doppler detection of lunar pull July 1998
Figure H9 shows the Doppler detection of the monthly 12 m/s pull of the moon on the Earth measured in sunlight using the first apparatus. Details in section 9 of
Ref. 4. Some time exposures for the latter data was taken with the assistance of Jian Ge,
who first visited Erskine's lab Thursday July 2, 1998 as a post doctoral researcher hired for the project.


Figure H9. The first EDI apparatus demonstrated Doppler velocimetry by observing sunlight over 1 month time. Details in
Ref. 4. The solar fringe shift was compared to an absolute wavelength reference provided by an iodine cell. After subtracting away the effect of the rotation of the Earth, the 12 m/s amplitude effect of the pull of the Moon on the Earth was detected. This also demonstrates that velocity drifts over 1 month time were not more than 8 m/s, and probably less than that. The 8 m/s scatter in the data could be due to a known dependence of the roof-top heliostat on pointing angle, acting on the 4000 m/s velocity gradient across the solar disk. The portion of error from the EDI itself, apart from the heliostat, was estimated at 4 m/s, based on the bromine repeatibility tests described in Fig. H11 [Ref. 1]


Figure H10. Schematic of EDI apparatus. Lens images light from source (fiber) to plane of the interferometer mirrors where fringes are formed. This plane is re-imaged by another lens to the entrance slit plane of spectrograph. This way, the interferometer phase can be made to vary linearly along the slit length, which is useful for recording all phases in a single exposure. (Another data taking mode is to have a uniform phase every along the slit and phase step in several exposures by moving the mirror on the PZT.) The interferometer is made to be angle independent by inserting a glass plate (etalon) in one of the arms, and superimposing the virtual image of the mirror on the plane of the other mirror. For ray paths this creates the appearance of zero delay (for all angles), but because of the slower speed of light in glass this creates a nonzero temporal delay, which creates the needed sinusoidal dependence on wavenumber (which is wavelength).

Figure H11. Zero-velocity repeatability provided by the EDI apparatus at LLNL, which also measured the lunar Doppler signature in sunlight of Fig. H9. A backlit bromine absorption cell was used to simulate a zero-velocity Doppler source having a stellar-like spectrum, and then an iodine absorption cell provided the usual spectral reference.

*This work was funded by the LDRD program (Laboratory Directed Research and Development), project 98-ER-054, at Lawrence Livermore Nat. Lab. from Oct 97 to Apr 2000. The author is grateful to Ed Moses, Charles Alcock, John Holzrichter and Rokaya Al-Ayat for their early strategic support of this project.

www.SpectralFringe.org site maintained by
David Erskine
erskine1@llnl.gov

To next page on history

Back to EDI home