Demonstration of 2x resolution boosting
on Lick Obs. echelle spectrograph
observing alpha-Virgo


R~50k boosted to R~100k

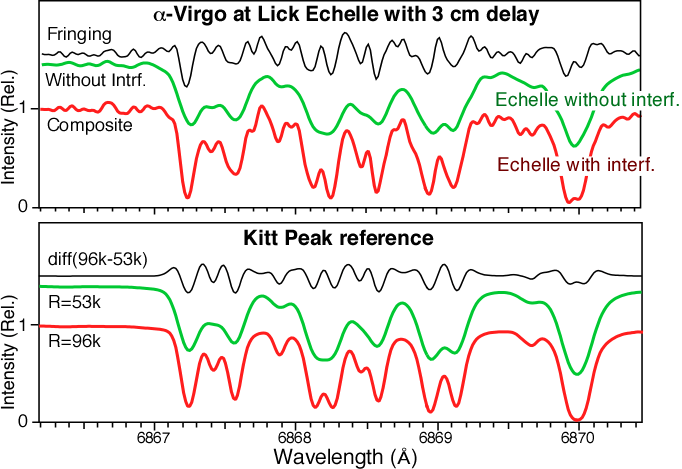
Demonstration of resolution boosting effect on an echelle spectrograph using the narrow telluric lines in starlight. This shows that the EDI technique even works in the presence of noise, which is photon noise due to the weak signal.

The top panel is measured spectra of alpha-Virgo. The green curve is the ordinary spectra having R~50 k resolution, measured without the interferometer fringes. The black curve is the fringing information contributed by the interferometer. The red curve is the enhanced spectra obtained by combining the ordinary and fringing contributions. It has an increased effective resolution of ~100 k, approximately double the ordinary resolution.
Remarkably, this is above the Nyquist limit imposed by Lick's CCD pixel spacing (about 16 per Å at 6868 Å, corresponding to R~60k).

Thus, even if the slit width was reduced, such high resolution could not be obtained conventionally while still maintaining the original bandwidth. If the grating were swapped with a higher dispersion grating, an increased resolution could be obtained, but only at the cost of lower bandwidth, because the number of pixels on the CCD limits how much information can be recorded conventionally. And the light efficiency of this higher dispersion grating is also markedly poorer.

The bottom panel displays theory curves showing what the spectra should look like. They are based on sunlight spectra recorded by the Kitt Peak FTS with resolution R~500k and artificially blurred to R~96k (red) or R~53k (green)).
 

Raw data and photos of the EDI apparatus at the Lick echelle spectrograph

For more info see Ref. 7

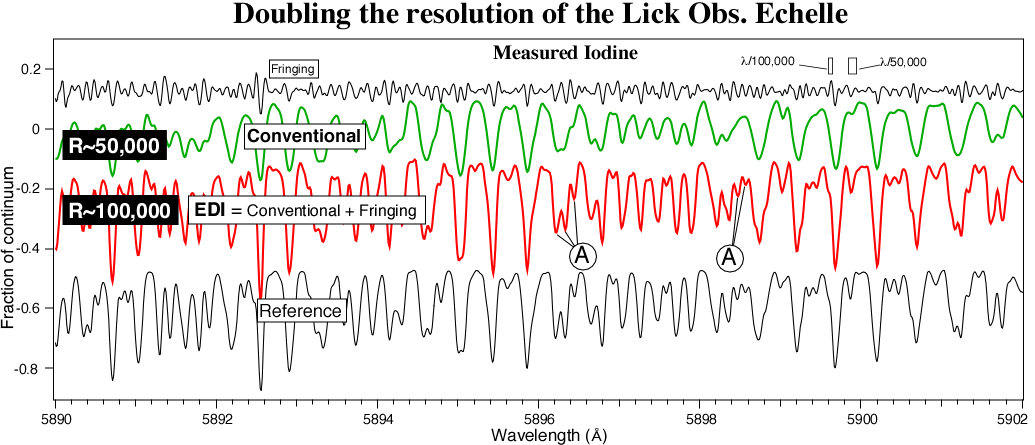
This is a similar measurement, made on the same apparatus but with a brighter source (iodine spectrum) so that photon noise is not an issue.

Measured iodine spectrum at Lick Obs. echelle spectrograph with EDI (red) and without (green) benefit of EDI. Without EDI, many narrow features (such as labeled "A" in the red curve) cannot be resolved by the R=50,000 intrinsic resolution of the spectrograph. However, when the EDI is used, fringes are produced (black curve). These are added in post-processing to the green curve to form the composite result (red curve). This has an effective resolution that is at least doubled R~100,000. This now matches well the textbook iodine spectrum (lower black curve) artificially blurred to R=100,000, for comparison. Higher boosting factors are possible with longer interferometer delays, (6x boosting has been recently demonstrated).

Back to EDI home

www.SpectralFringe.org site maintained by
David Erskine
erskine1@llnl.gov