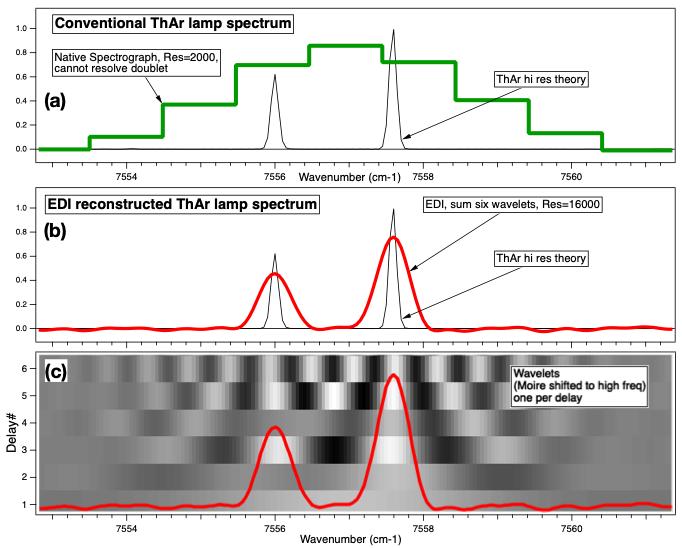
How EDI measures High Resolution Spectra-- beyond disperser capability Each measured moire pattern is mathematically processed to reverse the heterodyning effect, creating a wavelet. |
||
More explanation on how EDI boosts spectral resolution is at this page. |
||
What's cool: |
||
 |
||
Here is another section of the reconstructed spectrum, showing an interesting telluric feature near 4850 cm-1. The resolution boosting occurs simultaneously over the entire bandwidth of the native spectrograph, which for Triplespec is approximately 4200 cm-1 to 10,000 cm-1, or 2.4 microns to 1 micron. However the amount of boost is proportional to the wavenumber, or equivalently it is proportional to the maximum delay divided by the wavelength. Thus we obtain a larger boost at the shorter wavelength (larger wavenumber) end of the band. |
||
Wider Simultaneous Bandwidth |
||
 |
|
Combining four orders of the Triplespec spectrograph produces an extremely wide bandwidth at high resolution. Some of the orders overlap in their range. A zoomed in portion of the region where the B and C orders overlap provides a consistency check on the Spectral Reconstruction output, since entirely different pixels of the detector are being used to sense the same wavenumber. There is excellent agreement between the B and C orders, and between them and a theoretical model of atmospheric spectrum blurred to the same resolution (black in the lower graph but not shown in the upper graph). |
||
Site maintained by |
||||
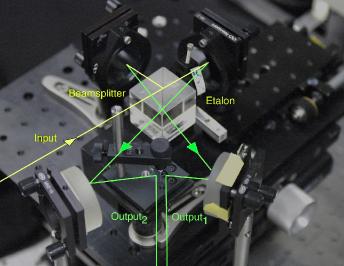
Demonstration of interferometric resolution boosting to 10-fold, which is the highest demonstrated to date on starlight (June 2011). The resolution and lineshape accuracy of a conventional spectrograph can be increased by factors of several by combining it in series with a small interfemeter, taking data in multiple exposures, then recombining the exposures after special data processing. Normally, the limiting spectrograph resolution scales with spectrograph size, since it is usually limited by detector pixel size, or aberrations in spectrograph lens optics, rather than slit width. The instrument lineshape accuracy is also stabilized by the mathematically simpler behavior of an inteferometer. Hence, EDI is a method of achieving the high performance of a much large spectrograph at the low size and cost of a smaller spectrograph. The tradeoff is slightly lower photon signal to noise ratio and more complicated data analysis. However, the improved instrument lineshape stability often makes the net performance a winner over the naked spectrograph, since many spectrographs are limited by their poor lineshape stability (affected by air convection, thermal drifts etc.) rather than photon noise performance.
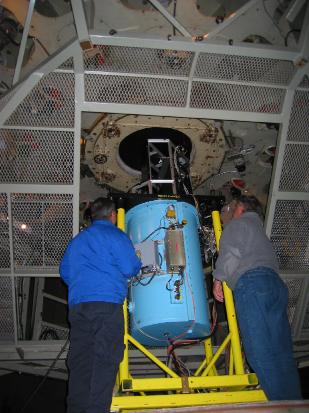
Here is reconstructed spectrum of starlight (kappa CrB) to a resolution 10x higher than the native spectrograph used without the EDI interferometer. The spectrograph was the IR "Triplespec" spectrograph of bandwidth 4000 to 10,000 cm-1 and resolution ~2700 at 4000 cm-1, mounted on the Cassegrain output hole of the 200 inch telescope at Mt. Palomar Observatory. The green dashed curve is the Triplespec spectrum without benefit of the interferometer, at a resolution of 2700. It cannot resolve many of the narrow features caused by atmospheric absorption (telluric lines). The red curve is the spectrum reconstructed by combining 7 delays worth of fringing data and special Fourier processing, in a technique called ISR (interferometric spectral reconstruction) or resolution boosting. It has an effective resolution of 27,000 and agrees well with a model of telluric features calculated by Henry Roe and artificially blurred by us to that resolution. A ThAr spectral lamp provides calibration emission lines. This graph shows only a small (110 cm-1) section of the reconstructed bandwidth which extends 6000 cm-1 from ~4000 cm-1 to ~10000 cm-1. The ISR res boosting technique is described in these 3 papers: Ten-fold SPIE, Scot16Bppr2.pdf, BoostApJ1693b.pdf.

New results June 2011
10x Resolution Boosting demonstrated at Mt. Palomar Observatory 200 inch
A small interferometer in series with a 2700 resolution IR spectrograph mounted on the 200 inch telescope boosts the net resolution 10x to 27,000. This resolution normally requires a spectrograph 10x larger in length and diameter-- too large to mount on this telescope. The extremely wide IR simultaneous bandwidth (4000-10000 cm-1) of spectrograph is maintained.
Our Aug 2011 SPIE paper describing the 10x demonstration is here, and journal article at Ref. 26.

10x resolution boost demo'd on starlight at Mt. Palomar 200 inch Hale telescope
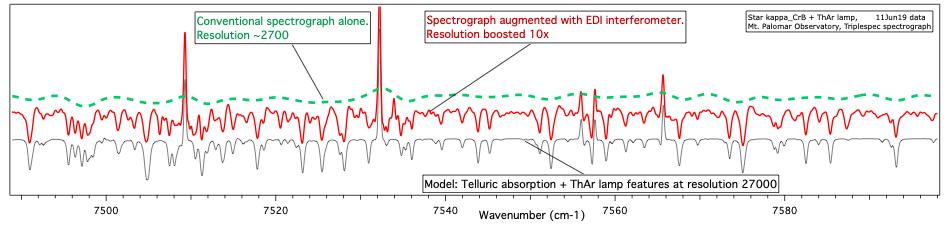
Demonstration of a 10-fold resolution boost observing telluric features mixed into spectrum of star κ CrB along with ThAr calibration lamp emission lines. The green dashed (top) curve is the “ordinary” spectrum measured without the interference, having native resolution 2700. It cannot resolve any of the telluric features. The red (middle) curve is the EDI (TEDI) reconstructed spectrum measured with seven contiguous delays, up to 3 cm, and equalized to a Gaussian resolution of 27,000. The gray (bottom) curve is a model of telluric and ThAr features blurred to resolution of 27,000, showing excellent agreement with EDI reconstructed data. Resolution boosting occurs simultaneously across the full bandwidth (0.9 to 2.45 μm) of the native spectrograph (final resolution varies linearly with wavenumber times largest delay). Y-axis is intensity, vertically offset for clarity. Data from June 19, 2011. See Ref. 26.